Skip to content
Boy pointing finger

Changes in poverty levels in the Commonwealth

In the last two decades, a net 189 million people have been lifted out of extreme poverty in the Commonwealth.

Source: World Bank (2019)

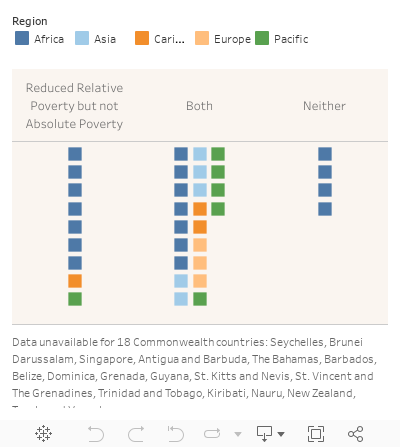
Commonwealth countries account for 19% of all people lifted out of extreme poverty in the world in the last two decades. Most member countries reduced both relative poverty (i.e. percentage of population that is poor) and absolute poverty (i.e. number of poor), but there are also some countries that only reduced relative poverty – indicating that population growth is outpacing the growth of people living under extreme poverty.

Undernourishment in the Commonwealth

Across the Commonwealth, access to hospital beds, as measured by the number of beds available per thousand people in a country’s population, has been in decline, according to the latest data available.

The Commonwealth average for hospital beds-to-population ratio stood at 2.73 beds per 1,000 people in 2010, compared to the world average of 2.70, reflecting a drop of nearly 26 per cent in bed capacity when compared with the Commonwealth average in the year 2000. The average for all the regions of the Commonwealth was below the World Health Organisation’s recommendation for every country to have a minimum five beds per 1,000 people.

With an average of less than 0.90 hospital beds per 1,000 thousand people, Bangladesh, Belize, Gambia, Ghana, India, Mozambique, Pakistan, Sierra Leone, Uganda, and Tanzania were the Commonwealth countries with the lowest capacity to offer in-patient treatment over the 10-year period tracked in this data set.

1.4 in 10 children who are out of school globally, are from the Commonwealth.

As of 2016, the Commonwealth countries account for 14% of the total children out of school that are of primary-school age but not enrolled in primary or secondary school globally. 57% of the 9 million children out of school in the Commonwealth are female, i.e. for every 5 children not in school in the Commonwealth, approximately 3 are female. Globally, the split is almost the same between males and females.

One in five Parliamentarians in Commonwealth countries are women

Rwanda has registered a 250% increase (from 14 to 49 out of 80 MPs) over the last two decades in the number of female MPs as a proportion of total MPs, the largest improvement recorded by any Commonwealth country in this period. On average, 19.5% of MPs in the Commonwealth countries are women. Data for 2018 shows the proportion of women parliamentarians is higher than the Commonwealth average for 22 countries. The countries that made the slowest progress in reducing the gender imbalance among parliamentarians in the same period are Solomon Islands, Sri Lanka, Kiribati, Kingdom of Eswatini and Tonga.

India, Pakistan and Botswana face extremely high levels of water stress

Source: World Resources Institute (2019)

The majority of Commonwealth countries face low or low-medium levels of water stress, partly explained by either being a coastal or island nation. Cluster of countries that are close to each other – the cluster of Botswana, Namibia, South Africa and Lesotho, and the cluster of Pakistan and India (not shown in the visualisation) face high water stress and possibly require enhanced support and intervention to become sustainable in the near future.

While there has been substantial progress, across the Commonwealth there remain substantial populations with limited access to electricity and further gains to promote renewable energy generation.

On average, the Commonwealth lags behind the world in access to electricity (~80% compared to ~88%) and the amount of energy generated by renewable sources (~20% compared to ~30%). African Commonwealth countries remain the most in need of improvement in access to electricity, with just over half of the population having access to electricity (53%). However, the African region generates over half (53%) of its energy from renewable sources, the highest region. Interestingly, Malawi has the lowest proportion of access to electricity at ~13% but approximately ~91% of this comes from renewable sources.

In comparison, in Europe, the highest performing region, 100% of the population have access to electricity. But Europe is the second worst performer for renewable energy generation estimated to be ~13%; with the UK the highest performer at ~25% renewable energy generation.

Since 2000, female labour force participation – the percentage of working age women who are actively engaged in the labour market – has, in most Commonwealth countries, steadily increased.

Women’s proportion of employment is generally lower then men’s and is a critical issue as labour force participation is a driver of growth, and in turn participation rates indicate a country’s potential to grow more rapidly. Similarly, female participation in the economy can help cushion the negative effects of economic shocks that impact households.

As the graph illustrates, there remain large differences in female labour participation across all regions reflecting the disparities in employment opportunities and unemployment, and the need for active labour market policies to engage and reduce barriers to employment for women.

Income inequality in the Commonwealth

African countries lead in improving income inequality in the Commonwealth

Source: World Bank (2019)

The chart shows the Commonwealth countries that made the greatest improvement in reducing income inequality in their respective regions between the years 2000 and 2016. In total, 16 Commonwealth countries reduced inequality – 8 from Africa, 3 from Asia, 4 from the Pacific and 1 from Europe. No country from the Caribbean and Americas region reduced income inequality in the same period. Countries that registered the biggest improvement across the Commonwealth are Botswana, The Gambia, Solomon Islands, Sierra Leone and Kenya. The countries that exacerbated income inequality are Zambia, Mozambique, South Africa, Malawi and Cameroon.

Urban pollution levels across the Commonwealth is decreasing but still dangerously high. Air pollution threatens the health of most city dwellers. In 2017, in all countries except Australia, Brunei Darussalam, Canada, New Zealand the annual mean levels of fine particulate matter (PM2.5) exceeded the World Health Organisation air quality guidelines of 10 micrograms or less per cubic metre.

In the Asia region, the mean level was more than four times and in Africa more than three times the guideline value. The Pacific region performed the best but still slightly above the air quality guidelines set by the World Health Organisation. Positively, however, all countries in Asia, Caribbean and Americas, Europe and the Pacific saw reductions in air population, which were as high as -64.23% in Sri Lanka.

There is still much work to do. Current readings means that across the Commonwealth 9 out of 10 people living in urban areas lacked clean air, and more than half of these people were exposed to air pollution levels at least 2.5 times higher than the safe threshold of particulate matter concentration. Across the world, in 2016, an estimated 4.2 million people died as a result of high levels of ambient air pollution. Air pollution does not recognise borders, and improving air quality demands sustained and coordinated government action at all levels.

Frequency of natural disasters in the Commonwealth

Natural disasters have increased in frequency in Commonwealth countries

Source: EM-DAT: The Emergency Events Database – Université catholique de Louvain (UCL) – CRED – Brussels – Belgium

Natural disasters have increased in frequency in Commonwealth countries. Countries are at risk from changes in climate patterns and have witnessed increased frequency of natural disasters. Moreover, greater number of people are affected today than ever before.

Historical Comparison of Frequency of Natural Disasters between Commonwealth Regions

Natural disasters include droughts, earthquakes, flood, storms and wildfires.

The Bahamas and the United Kingdom are two island countries in the Commonwealth that have increased their protected areas (both terrestrial and marine) as a percentage of total territorial area, in the recent past. Protected areas are areas managed mainly for sustainable use. Grenada, Dominica, Samoa and Australia have shown positive growth in the same period.